Hi,
An observation and related questions.
I create an sp analysis in an Assembler test named ss. Add output expression spm('sp 1 1) and name it S11. Run simulation, then with cursor over the plot icon in the results tab I select Direct Plot>Main Form, select Z-Smith, check the box for Add To Outputs, then click S11 button. Smith chart appears with S11 plotted as expected. Close plot window. Back in Assembler outputs setup I don't see an additional expression for my direct plot. If I decent into ss Explorer window an additional expression appears in the outputs. I then ascend back to Assembler. I now have two identical expressions and names in the output setup table.

To avoid confusion I rename the second expression to S11_dp. Click Run simulation button, click Plot All icon. I now get a plot with two subwindows, one subwidow has S11 which is a magnitude plot and the other subplot has S11_dp which is a Smith chart.

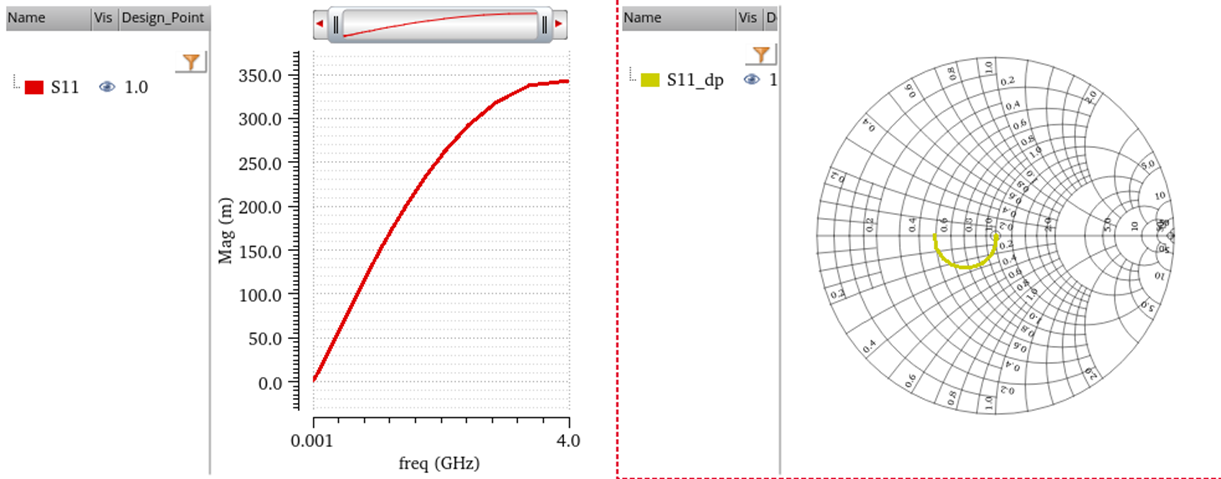
So I have two identical expressions but somehow Assembler knows to send one to a magnitude plot and the other to a smith chart plot. How does Assembler know? Where is this information stored? If I close Assembler and return a week later, how do I know which expression(s) where came from Direct Plot or were manually entered?
I would like to manually enter the expression and have it go to a Smith Chart without using Direct Plot or a template. How can this be done?
Btw – Normally Assembler won’t let me enter two identical names and I wouldn’t want to. The fact that it is doing this seems a little buggy to me. Also, the user shouldn’t have to descent to Explorer for the expressions list to update.
Regards,
Brad