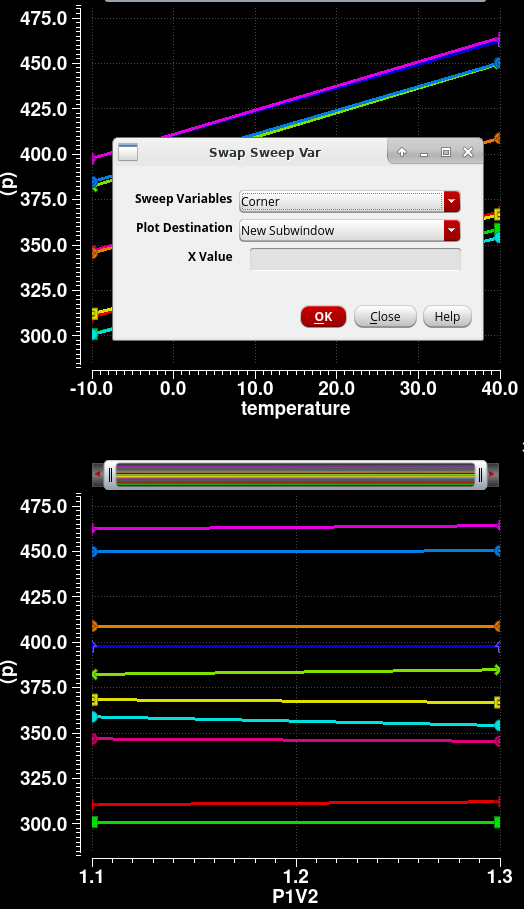
I basically want to represent the data in the result table, i.e., measurement vs corners, in a form of plot.
I am expecting measurements as y-axis vs corners as x-axis.
a few weeks ago I saw a presentation that show exactly this.
There is an option for this but somehow it does not work.
Is there any thing that I can try?